
After a drainage network has been created and the simulation has been successfully run, VO SWMM’s dual-drainage model results display key analytical insights. These results visualize flooding and assess the status of drainage network links and nodes to determine if they are submerged.
The tools we will review come from analyzing the results of measured surcharge, flood mapping, and manhole inflow. These results equip stakeholders and decision-makers to plan, design, and implement sewer system solutions that enhance sewer systems.
1. Surcharge Analysis
The primary objective of conducting a surcharge analysis using VO SWMM is to identify critical surcharge levels that signal a risk of exceeding system capacity. This analysis is crucial for planning targeted maintenance and capacity enhancements to maintain efficiency and reliability.
Visual Indicators of Surcharge Levels
Figure 1 below shows the different water level thresholds. Note that “Freeboard” is the vertical distance between the design water level and the top of a structure.
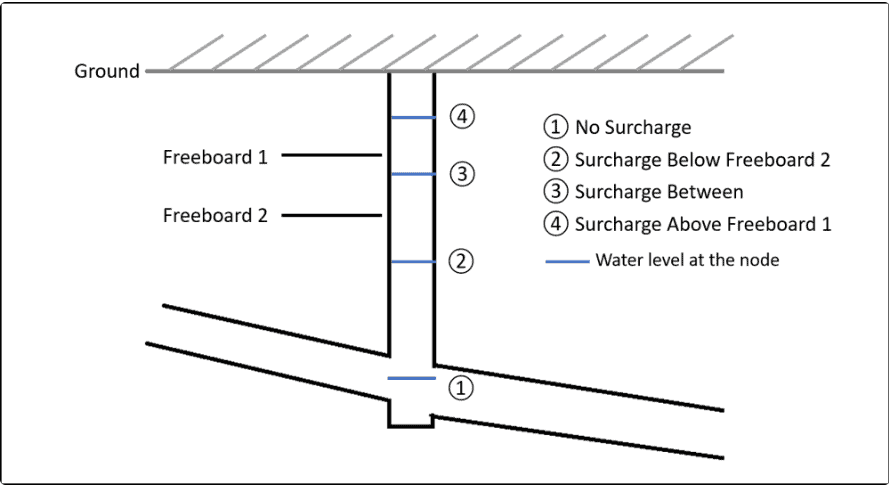
1. No Surcharge: Nodes operate within normal capacity..
2. Surcharge Below Freeboard 2: Indicates early warning levels where water approaches critical levels but is below the first safety margin.
3. Surcharge Between Freeboard 1 and 2: Represents a critical warning stage where water levels are nearing or have reached the primary safety threshold.
4. Surcharge Above Freeboard 1: This level indicates that the water has exceeded the primary safety margin, often triggering immediate action.
Freeboard is the vertical distance between the design water level and the top of a structure. VO SWMM defines two freeboard levels:
1. Freeboard 1: The primary safety margin, often mandated by regulatory standards, varies based on the potential risk and scale of the system. Typical values range from 0.6 meters (2 feet) for major systems to lower values for minor systems.
2. Freeboard 2: An additional safety buffer below Freeboard 1, serving as an early warning threshold to indicate rising water levels before reaching the primary safety margin.
Display of Surcharge and Flooding Analysis Results
VO SWMM’s Surcharge Analysis results use color-coded links and nodes to indicate various surcharge levels.
As shown in Figure 2 below, the colors of links and nodes reflect their surcharge levels. For example, the red link shows the water has passed Freeboard 2.
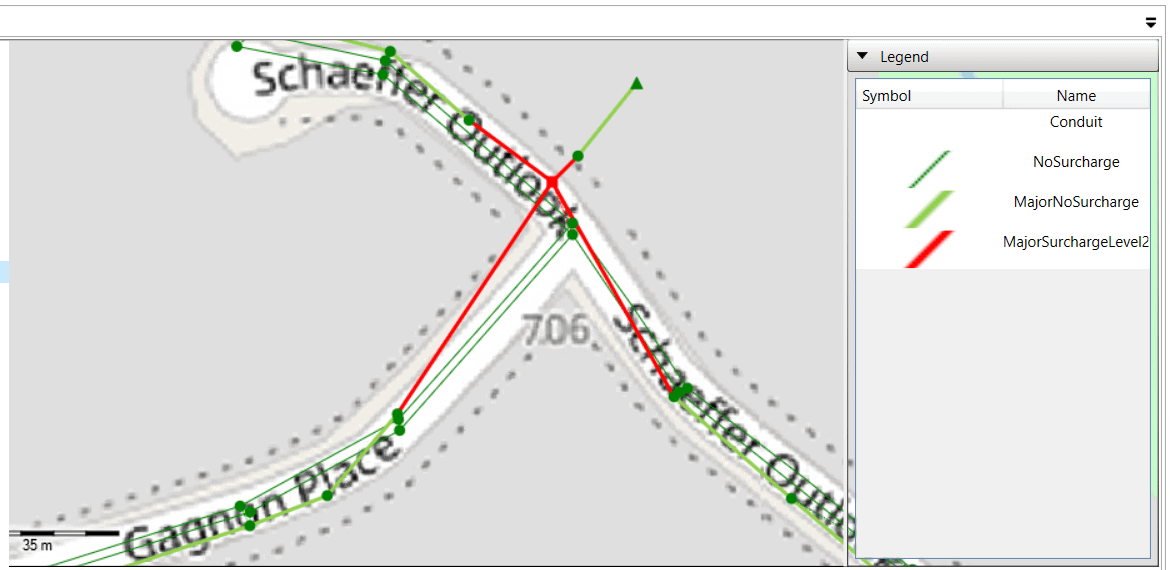
This visual representation aids in quick identification of areas requiring attention and supports strategic decision-making for infrastructure management.
Key Features of VO SWMM’s Surcharge Analysis
1. Node Recognition and Water Level Assessment:
VO SWMM evaluates each node within the system to assess water levels, facilitating informed decisions about infrastructure improvements and resource allocation.
2. Automatic Symbol Update:
Based on the surcharge and flooding analysis results, VO SWMM updates node and link symbols automatically. This feature visually represents the surcharge status across the system, enhancing the user’s ability to quickly interpret data.
Case Study Insight
In a recent project involving dual-drainage modelling for a residential area, surcharge analysis was instrumental in identifying nodes at risk of overtopping. Using VO’s visual indicators, engineers pinpointed links requiring immediate attention, optimizing the deployment of maintenance resources. This proactive approach prevented potential flooding during a subsequent 1:25-year storm event.
2. Flood Mapping
Flood Mapping offers a comprehensive view of potential flood-prone areas, aiding in the identification of zones at higher risk of surface flooding. It equips users with the ability to visualize and anticipate flooding scenarios. Figure 3 illustrates an example of mapped flood areas.
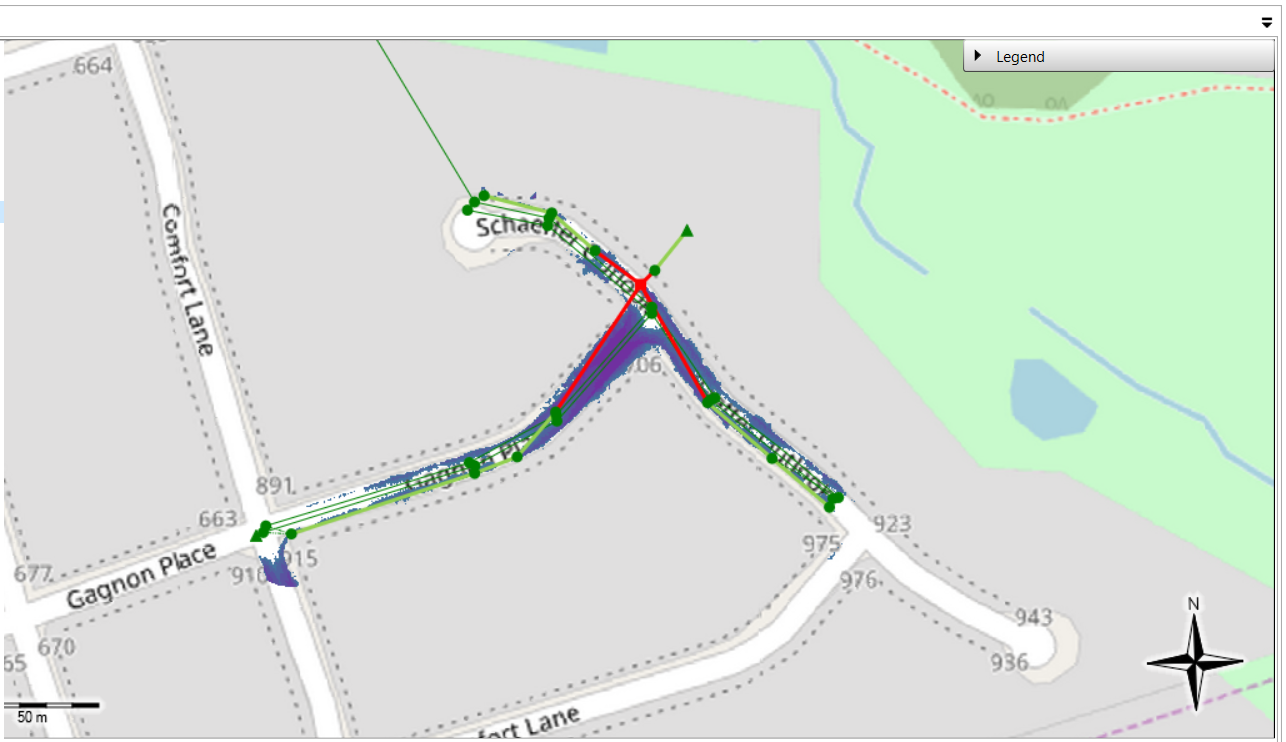
In VO, flood mapping integrates the calculated water levels from the models with the terrain data from the DEM. VO identifies areas where the water depth exceeds the ground surface elevation, generating a flood extent and depth map. In other words, by comparing the simulated water surface elevations with the DEM, VO determines where water overtops the ground surface, identifying areas of inundation.
Case Study Insight
During an industrial area study, flood mapping revealed surface water depths exceeding 0.5 meters in specific locations, hindering vehicle access. By integrating flood mapping results with roadway improvement plans, engineers proposed optimized grading and culvert designs to ensure compliance with local standards, such as Ontario’s ECA regulations.
3. Manhole Inflow Analysis
The results of the Manhole Inflow analysis shows the interactions between overland flow and the drainage system. To use this tool, the overland flow must first be modelled and connected to the drainage network.
This analysis’ results show which sanitary manholes may become submerged, a crucial aspect for compliance with Ontario’s ECAs legislation, specifically as outlined in sections 2.10.7 and 2.10.8.
Section 2.10.7 explains that sanitary maintenance holes should ideally be located away from overland flow routes. According to Section 2.10.8, if a sanitary maintenance hole cannot be positioned outside the overland flow path for a 25-year storm event or cannot be benched, an analysis must be conducted to verify specific conditions. The manhole inflow analysis determines whether overland flow will submerge a maintenance hole. If submersion is confirmed, the design must ensure watertight integrity through water-tight covers. Additionally, if multiple consecutive maintenance holes require sealing due to potential submersion, proper ventilation measures must be incorporated.
The results of this analysis are presented in a map, using color-coding to show the status of each manhole. Figure 4 illustrates an example of manhole inflow analysis, highlighting the ease to conduct this critical compliance check. The red nodes indicate surcharge, and the black nodes indicate no surcharge. This analysis is based on the 25-year design storm in accordance with ECA legislation.
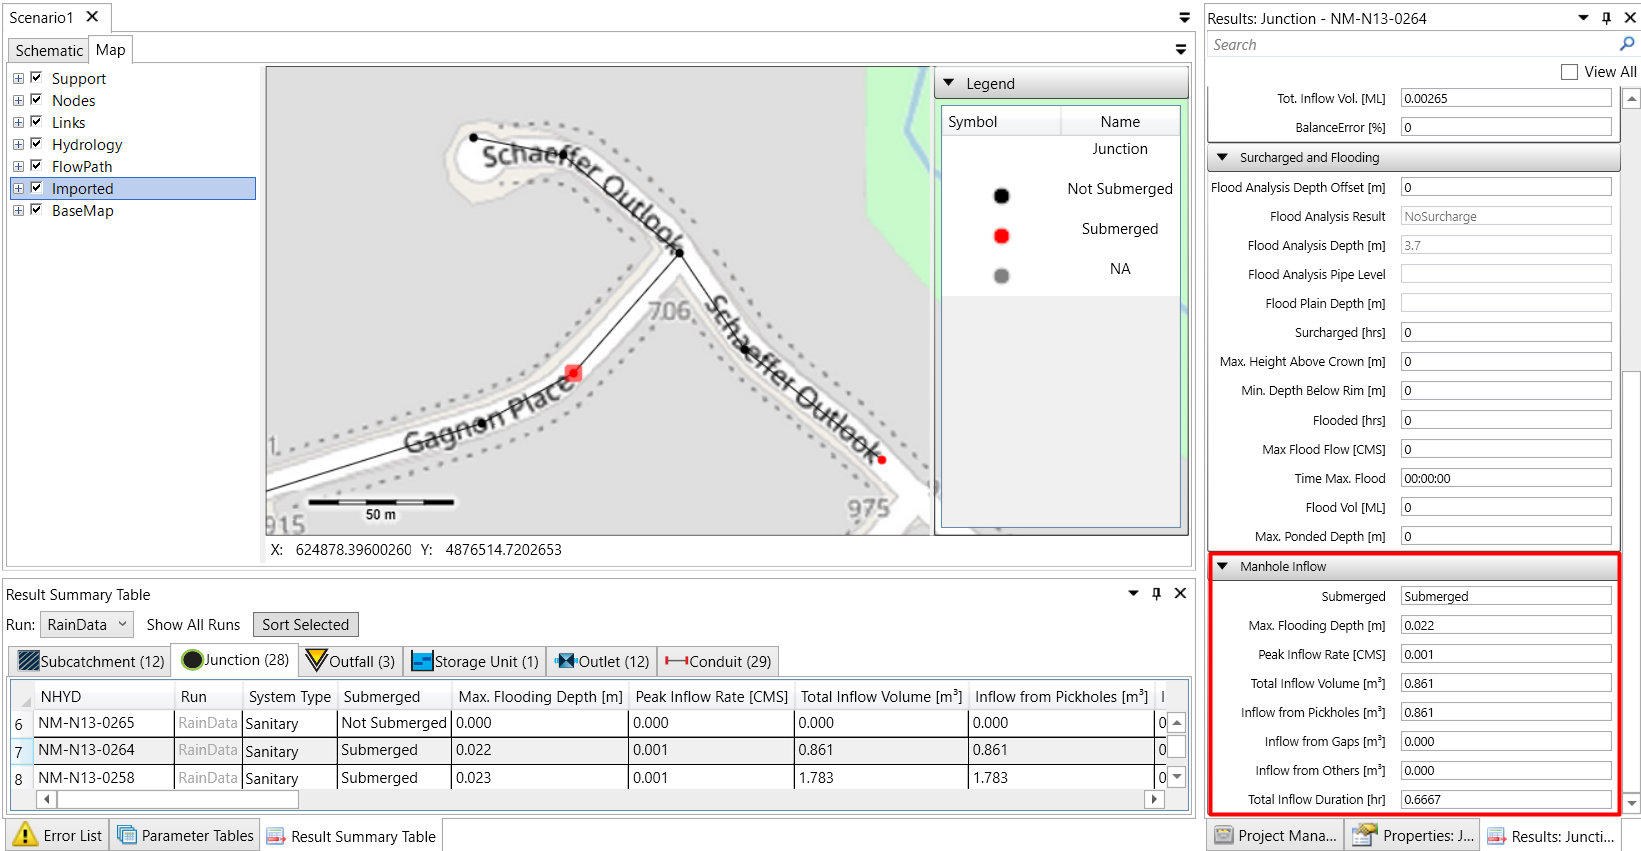
By identifying whether a manhole is submerged and requires additional measures, these results help a modeler easily comply with ECA requirements.
Case Study Insight
A municipal drainage project revealed that several sanitary manholes were at risk of submersion during a 1:25-year storm. VO’s manhole inflow analysis identified specific manholes requiring watertight covers. By implementing these measures, the project achieved compliance with ECA requirements, preventing potential environmental hazards.
Conclusion
In this blog article on dual-drainage modelling, we’ve delved into the functionalities and benefits of VO SWMM’s surcharge analysis, flood mapping, and manhole inflow analysis. These tools provide critical insights for enhancing urban drainage systems, ensuring regulatory compliance, and improving urban resilience against flooding.
Through these analyses, stakeholders can proactively address infrastructure vulnerabilities, aiding in both short-term maintenance and long-term planning. VO SWMM’s capabilities are developed to facilitate smarter, more sustainable approaches to urban water management.
For a deeper understanding of dual-drainage modeling and to explore more of VO SWMM’s features, visit Smart City Water’s webinar library Here
To request a VO license, click here
